
We’ve been helping organisations and individuals develop their critical data skills for over a decade. Our courses are hands-on, interactive and structured for directly applicable learning outcomes.
We can provide individual training workshops on key topics; longer courses on end-to-end processes or frameworks; and bespoke training to suit your unique requirements. We deliver in-house or through partners providing open courses that individuals can book.
Get in touch to find out more about accessing our training.
Current example courses
-
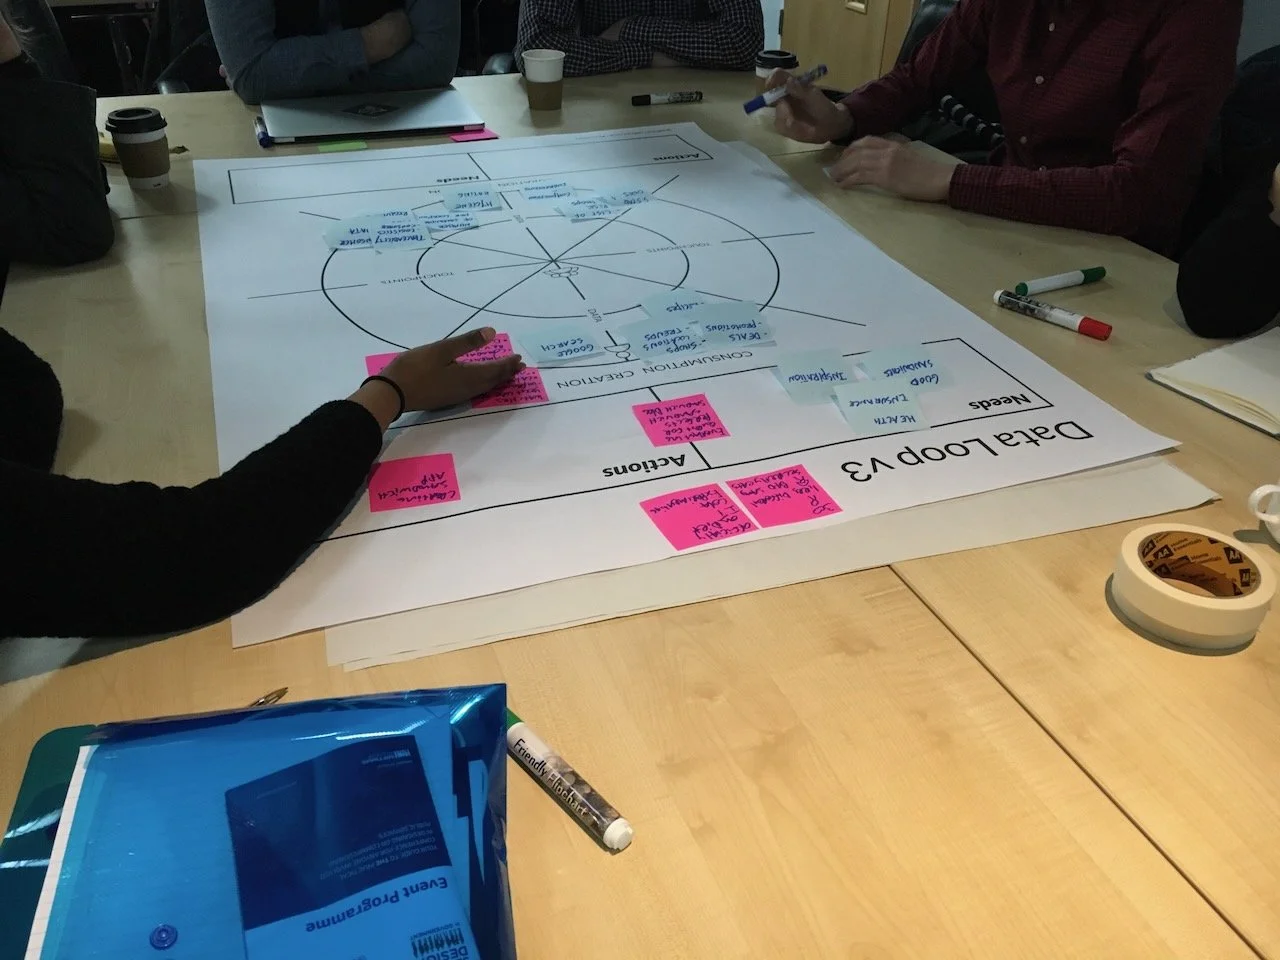
Data for Designers
Aimed at design professionals, this one-day course introduces core data concepts and applications for designers working across products, services and systems.
Drawn from The Data Place’s experience of participatory design processes in multiple sectors the course also introduces a toolkit for working with data as part of workshops and other facilitated design work.
-

Data, Design and Systems
Aimed at mid-level and senior management, this five day course brings together systems thinking, service design and data skills in an end-to-end intensive, hands-on programme that provides a framework for responding to complex business situations.
Participants will either bring their own data challenges to explore during the course, or for those who don’t wish to share their own challenges we will provide a selection of scenarios across different industries and contexts to choose from.
-

Principles of Machine Learning and AI
Designed to support learners who are curious about the concepts and benefits of machine learning and AI, this short course combines presentation of real-life examples, discussion activities, and hands-on exercises, to help participants understand the context and the problems that different models can be used to solve, and how to build, train and test a selection of supervised and unsupervised models.
-

Crafting Meaningful Insights with Power BI
Designed to support new and current users of Microsoft’s powerful business intelligence platform, this one-day course combines presentation of real-life examples, discussion activities, and hands-on exercises, to help participants build truly effective visual assets to share with colleagues.
-

Introduction to Python
Designed to support learners who are new to Python, this short course combines presentation of real-life examples, discussion activities, and hands-on exercises, to help participants write basic programmes and work with inbuilt Python functions.
-

Data Analysis for Beginners
Designed to support learners who are either new to data analysis, or would like to revisit core principles, this two-day course combines presentation of real-life examples, discussion activities, and hands on exercises, to help participants manage, prepare, analyse and present data for more effective analysis.